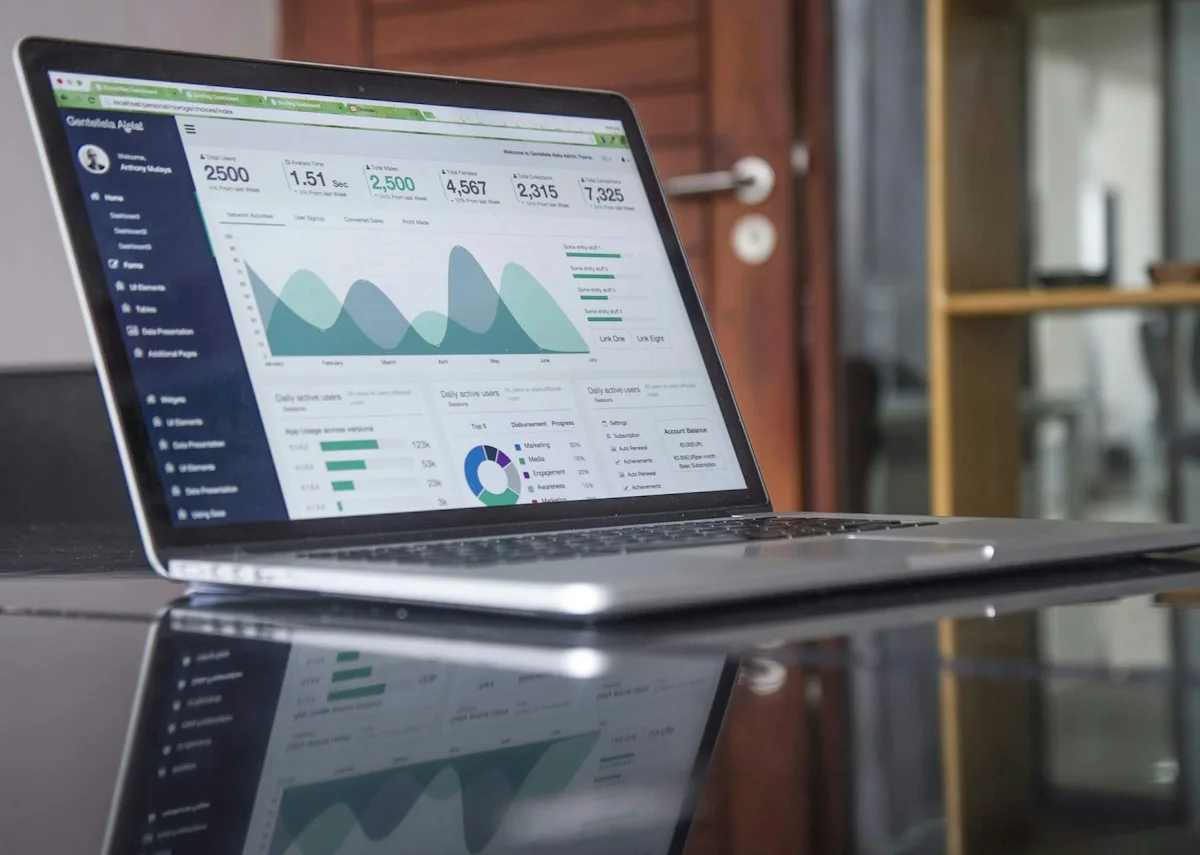
Find the patterns.
Explain what they mean.
Meaningful analysis starts with a clear question and a method that fits the evidence.
I work across data cleaning, exploratory analysis, statistical modelling, forecasting and visual reporting. Machine learning and computer vision projects add practical experience with classification, anomaly detection and object recognition.
For researchers and organisations, I can support the analytical process and communicate findings through structured reports and clear visualisations.
Writing & research
Data & statistics
AI & development
Statistical research
Survey analysis, descriptive and inferential statistics, methodology selection and transparent interpretation.
Predictive modelling
Classification, anomaly detection and time-series forecasting using Python and R.
Dashboards & reporting
Power BI, Tableau and Excel reporting with SQL-backed data preparation and clear narratives.
Clear deliverables. Defined scope.
See what's included
- Prepared datasets and exploratory analysis
- Statistical and analytical reports
- Dashboards and data visualisations
- Forecasting and model-based interpretation
The right tools for the work.
 Python
 R
 SQL
 Power BI
 Tableau
 IBM SPSS
 Excel
 MySQL
The tools, outputs and review stages follow your data and question. Scope and timelines are agreed before analysis begins.
Explore related workFrom requirements to delivery.
What we can develop
See what's included
- Data preparation and exploratory analysis
- Statistical analysis and forecasting
- Dashboards and research reporting
Researchers, universities and businesses needing practical analytical support.
What you receive
See what's included
- Prepared data and documented analytical steps
- Charts, tables and an agreed dashboard or report
- Interpretation of findings, assumptions and limitations
The question, data sources, review points and reporting dates are agreed before analysis begins.
How the work progresses
We define the question and available data, check quality, choose an appropriate method and communicate the findings with transparent interpretation.
Python, R, SQL, Power BI, Tableau or SPSS is chosen to suit your data size, audience and existing reporting tools.
- Python
- R
- SQL
- Power BI
- Tableau
- IBM SPSS
- Excel
- MySQL
Your questions,
answered.
Which data analysis and research tasks can you support?
I support data cleaning, exploratory analysis, survey statistics, forecasting, data visualisation, dashboard development and applied machine learning. The method is chosen around the research question, dataset and reporting requirements.
Which software do you use for analytics?
My toolkit includes Python, R, SQL, Power BI, Tableau, IBM SPSS and Excel. Depending on the brief, I use Pandas, NumPy, scikit-learn, Matplotlib or ggplot2 for preparation, modelling and visualisation.
What evidence of your data and AI work is available?
My project portfolio includes computer vision, anomaly detection, time-series forecasting and business dashboards. Public GitHub repositories provide source code and documentation where available.
What is the difference between data analytics and machine learning?
Data analytics examines existing data to describe what happened and why, usually through summaries, charts and statistical tests. Machine learning builds models that learn patterns from data to predict or classify new cases.
Which tools do you use for dashboards?
Power BI and Tableau are used for interactive dashboards, with Excel, SQL, Python or R used to prepare and analyse the data behind them.
Can you help a small business with data analysis?
Yes. Sales, customer or operations data can be turned into clear reports and dashboards that show trends and support decisions. Start by describing the question you want answered.
How should I handle sensitive data?
Discuss data sensitivity before sharing anything. Where possible, send anonymised data and agree how files will be shared and handled before analysis begins.